Bootstrap your own BI
Go From Google Sheets to Dashboards, in Seconds, with NoCode
- You don't need an army of analysts for your data team
- Forget Databases, SQL, ETL processes
- Simply plug and play on your scattered google sheets
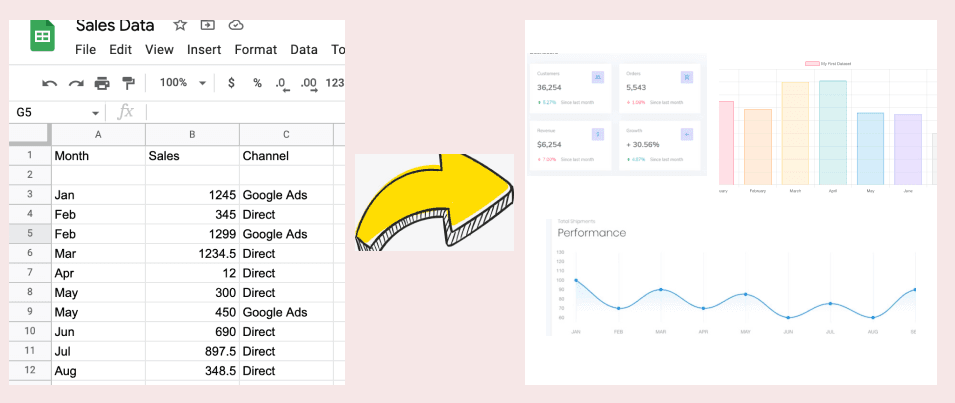

Central Monitoring
Your data maybe spread across sheets, but visualize important KPIs at a single place. No need to build complicated SQL queries.

Fully Customizable
Plot exactly what you want, in the way you want. You choose the columns to plot. Whether to make scatter plots, line charts, bar charts, highlight important top level metrics.

Clean Data
Do not waste time cleaning data. We do this for you. Data cleaning is one of the most time consuming function for new data teams. We take care of this for you.

Excel Files
We understand your data maybe in excel files. All you need to do is upload the excel files to google drive, and give us permissions to access the folder

No code
Purely #nocode solution. We give you options on what columns you wish to plot and how

Auto Updates
Dashboards get updated automatically, when you update your data. You don't need to do anything.